Tuesday, November 30, 2010

Audio-Visuals

Audio-Visual
The term audio-visual (AV) may refer to works with both a sound and a visual component, the production or use of such works, or the equipment involved in presenting such works. Films and television programs are examples of audio-visual presentations.
Business presentations are also usually audio-visual. In a typical presentation, the presenter provides the audio by speaking, and supplements it with a series of images projected onto a screen, either from a slide projector, or from a computer connected to a projector using a presentation program (software).
The term audio-visual is used usually as industry jargon, expressing works with a type of visual and/or audio format. In the developed world, there has been a huge uptake of computer-based audio-visual equipment in the education sector, with many schools and higher educational establishments installing projection equipment and often using interactive whiteboard technology.
Audio-visual consists of  i-Pods,MP3, MPEG etc.
MPEG:
            Moving Picture Experts Group, and pronounced m-peg. MPEG  is a working group of the ISO . The term also refers to the family of Digital video compression standards and file formats developed by the group. MPEG generally produces better-quality video than competing formats, such as Video for Windows, Indeo and QuickTime. MPEG files previously on PCs needed hardware decoders (codecs) for MPEG processing. Today, however, PCs can use software-only codecs including products from RealNetworks, QuickTime or Windows Media Player.
The major advantage of MPEG compared to other video and audio coding formats is that MPEG files are much smaller for the same quality. This is because MPEG uses very sophisticated compression techniques
The MPEG compression methodology is considered asymmetric as the encoder is more complex than the decoder.MPEG algorithms compress data to form small bits that can be easily transmitted and then decompressed. MPEG achieves its high compression rate by storing only the changes from one frame to another, instead of each entire frame. The video information is then encoded using a technique called Discrete Cosine Transform (DCT). MPEG uses a type of  lossy compression, since some data is removed. But the diminishment of data is generally imperceptible to the human eye.

The major MPEG standards include the following:
MPEG-1: The most common implementations of the MPEG-1 standard provide a video resolution of 352-by-240 at 30 frames per second (fps). This produces video quality slightly below the quality of conventional VCR videos . The first MPEG compression standard for audio and video. It was basically designed to allow moving pictures and sound to be encoded into the bitrates of a Compact Disc. It is used on Video CD, SVCD and can be used for low-quality video on DVD Video. It was used in digital satellite/cable TV services before MPEG-2 became widespread.
MPEG-2: Offers resolutions of 720x480 and 1280x720 at 60 fps, with full CD-quality audio. This is sufficient for all the major TV standards, including NTSC, digital satellite TV services like Dish Network, digital cable television signals and even HDTV. MPEG-2 is used by DVD-ROMs. MPEG-2 can compress a 2 hour video into a few gigabytes. While decompressing an MPEG-2 data stream requires only modest computing power, encoding video in MPEG-2 format requires significantly more processing power.
MPEG-3: Was designed for HDTV but was abandoned in place of using MPEG-2 for HDTV.
MPEG-4: Coding of audio-visual objects means A graphics and video compression algorithm standard that is based on MPEG-1 and MPEG-2 and Apple QuickTime technology. Wavelet-based MPEG-4 files are smaller than JPEG or QuickTime files, so they are designed to transmit video and  images over a narrower bandwidth and can mix video with text, graphics and 2-D and 3-D animation layers. MPEG-4 provides the standardized technological elements enabling the integration of the production, distribution and content access paradigms of Digital television, Interactive graphics applications, and interactive multimedia. MPEG-4 supports Intellectual Property Management and Protection (IPMP), which provides the facility to use proprietary technologies to manage and protect content like digital rights management.
MPEG-7: Formally called the Multimedia Content Description Interface, MPEG-7 provides a tool set for completely describing multimedia content. MPEG-7 is designed to be generic and not targeted to a specific application.
MPEG-21: Includes a Rights Expression Language (REL) and a Rights Data Dictionary. Unlike other MPEG standards that describe compression coding methods, MPEG-21 describes a standard that defines the description of content and also processes for accessing, searching, storing and protecting the copyrights of content. MPEG-21 Multimedia Framework initiative that aims to enable the transparent and augmented use of multimedia resources across a wide range of networks and devices.


(  
This article is the topic of unit "IT Trends" from Nagpur University syllabus MBA 3 rd Sem IT  notes.

Topics of this unit are is covered in other blog post. Links are given below.
  1. Biometrics
  2. Neural Network
  3. GIS-Geographical Information System
  4. Google Earth
  5. I-Pod
For more notes you can also refer to other links as given below 
 
)

Sunday, November 14, 2010

Google Earth

Google Earth
Introduction:
            Google Earth is an excellent tool for geography. While some may think it is merely to see one's house from space, the GIS abilities to add overlays and study data spatially is a key component to geography.

            Google Earth is virtual globe, map and geographical information program. The original name was Earth Viewer 3D, which was created by Keyhole Inc. , which then acquired by Google in 2004.Initial release on June 28,2005 as Google Earth.  Maps in Google Earth are available from satellite imagery, aerial photography and GIS 3D.
            There were three licenses of Google Earth software named as Google Earth, a free version; Google Earth Plus which is now discontinued had some additional features and Google Earth Pro, which is intended for commercial use cost $399 per year. Google Earth is also available as a browser Plugin, made available for mobile viewers.
            For large parts of the surface of the Earth only 2D images are available, from almost vertical photography. Google Earth displays satellite images of varying resolution of the Earth’s Surface. This allows users to see cities, houses. Streets etc.  perpendicularly down or at an oblique angle. All  Images viewed by Google Earth aren’t of high resolution but some of images of popular cities such as Melbourne, Victoria, Las Vegas, Nevada, Cambridge etc. or popular  mountains/valleys like Mount Everest, Grand Canyon etc. also available in three dimensions.
 For these 2D and 3D images Google Earth use previously digital Elevation model (DEM) and nowadays use Supplementary digital Elevation model by NASA’s Shuttle Radar Topography Mission. Google Earth supports managing three-dimensional Geospatial data through Keyhole Markup Language (KML).
            There are various versions of Google Earth Software. Now there is version 5.0 available in 37 languages including Hindi.
Features:
1.      Wikipedia and Panoramio Integration: In 2006, Google Earth added a new layer named “Geographic Web” which includes integration with Wikipedia and Panoramio.

2.      Flight Simulator: This feature was included as hidden feature in old version but now it is not hidden. Flight simulator can be used with only few airports and controlled by mouse, keyboard or joysticks. We can experience a very realistic views, also feel like the cockpit of a plane.


3.      Sky Mode: This allows users to view stars and other celestial bodies.

4.      Water and Ocean: This allows users to zoom below the surface of ocean and view the 3D bathymetry beneath waves.

5.      Historical Imagery: This allows users to traverse back in time and study earlier stages of any place. This feature is very useful for research purposes that require analysis of past records of various places.

6.      Mars and Moon: For research and information purpose Google Earth provides their high resolution images.


7.      Overhead Satellite and Aerial Imagery

8.      Ability to create and save Placemarks and folders. Placemarks can either be clamped to the ground, or can appear above ground at a specified altitude


9.      Integration with Internet resources

10.  3D Landforms and 3D Buildings

11.  Tools for measuring and creating paths

12.  Access to a community of users who have developed Google Earth applications

13.  Searching:
Users may search (Fly to) using the following parameters:
     Address (street and zip code for US)
     Place Name (eg.  Paris, France)
     Keyword(s)
     Latitude/Longitude Coordinates


Flight simulator

Specifications:
Google Earth shows the earth as it looks from an elevated platform such as airplane or orbiting satellite. The projection used for this purpose is named as General Perspective. The coordinate system is geographic coordinate means latitude/longitude.
Baseline and typical high resolutions are different for different countries.Age of images are different, if there are in changes in places due some activities are updated as early as possible.
Minimum hardware requirement is P-3, 256 RAM,400 MB free disk, 128kb/s  Network speed, 16 MB 3D Graphic Card and Window XP,7,2000,Vista or Linux or Mac OS X.
Now about the licenses provided by Google Earth described as below;
1.      Google Earth Plus: This was discontinued in Dec. 2008. This was an individual oriented paid subscription. This included GPS Integration, High resolution printing, Customer support via e-mail, high data download speeds.
2.      Google Earth Pro:  This is paid version of $399 annual subscription fee. It is Business-oriented. This provides movie making, GIS data importer, Advanced printing modules, Radius and are measurements. This doesn’t work on Linux.
3.      Google Earth Plug-in: Google Earth Plug-in and its JavaScript allows users to place version of Google Earth into Web pages but doesn’t provide all feature of Google Earth.

 Google Earth Compatible to Google Chrome, Internet Explorer 6.0+, Firefox 2.0+, Safari 3.1+.
Layers:
Google also features with many layers as a source for information on businesses, point of interest and also showcasing the content many communities such as Wikipedia, Panoramio and YouTube.
This includes
1.    Panoramio : Most relevant pictures uploaded on Panoramio’s website displayed on Google Earth.
2.    Roads: Displays available road networks in different colours according to road types.
3.    3D Buildings: Sows many buildings in major cities in photorealistic and gray view.
4.    Borders and labels
5.    Weather: This includes clouds, Radar, Conditions and Forecasts.
6.    Sky Layers: This consists of Current sky events, Earth and sky podcasts, hubblecast, Our Solar System, Hubble Showcase, Rumsey Star Maps.

Students can use Google Earth to:
• study natural and political maps
• learn map reading and navigation
• visually explore historical, news, and census data
• annotate locations and share with others
• create their own 3D models to overlay on maps
• download geographically-referenced information


(  
This article is the topic of unit "IT Trends" from Nagpur University syllabus MBA 3 rd Sem IT  notes.

Topics of this unit are is covered in other blog post. Links are given below.
  1. Biometrics
  2. Neural Network
  3. GIS-Geographical Information System
  4. Audio Visuals MPEG
  5. I-Pod
For more notes you can also refer to other links as given below 
 
)

Thursday, November 11, 2010

GIS:Geographical Information System

GIS
     
Introduction:
GIS means a Geographical Information System, it is  any information system which integrates hardware, software & data for capturing, storing, integrating, editing, analyzing, sharing, managing & displaying  geographic information for informing decision making or  data identified according to location. It consists of hardware and software that make it possible for digitized maps to be overlaid with data.
GIS allows us to view, understand, question, interpret and visualize data in many ways that reveal relationships, patterns, and trends in the form of maps, globes, reports and charts.
GIS has some boundaries which may be jurisdictional, application oriented or purpose oriented for which specific GIS developed. Every GIS has its own boundaries.
These systems are used in remote sensing, navigation, localized search Engine, geography, emergency management, natural resources management etc.
GIS is used in emergency planner in the case of a natural disaster; asset management, location planning, warfare assessments, in criminology , remote sensing etc.
Data used in GIS is available in new formats, including digitized maps, machine-readable census data, and other machine readable data—including locally produced machine-readable statistics. 
There are applications of GIS which are tools that allows users to create queries, analysis spatial information, edit data, maps & present result of all operations.
GIS software represents features on the earth, such as buildings, cities, roads, rivers, and states, on a computer. People use GIS to visualize, question, analyze, and understand this data about the world and human activity .Often, this data is viewed on a map, which provides an advantage over using spreadsheets or databases.
The 1st GIS was developed by Dr. Roger Tomlinson named as Canada Geographic Information System (CGIS) which was 1st true operational GIS was used to store, analyse and manipulate data collected for the Canada Land Inventory (CLI). Since Dr. Roger Tomlinson has been known as “Father of GIS”.

Advantages & Applications:
Cities, streets, and rivers are not the only physical locations that can be mapped. GIS can be used to map dynamic events such as the path of a hurricane or the spread of a disease outbreak.
It helps the businesses to learn about their customers. E.g. A clothing Stores that target Youth can create maps showing where max. youth live so they can target their marketing activities to just those areas. It also helps business for better decision making, improved communication & accurate record keeping.
GIS makes map data interactive and, thus, more useful. For example, a GIS shows a street as more than a screen graphic—you can click on a GIS street map to find out the speed limit, the number of lanes, the last time it was paved, any planned construction, and a multitude of additional related facts. All this information provides an accurate understanding of the street. If a city needed to widen this street, it could use GIS to create a 50-foot buffer on the street to find the properties that fall within the buffer.
 GIS can then easily identify property owners affected by the project so that they may be contacted. GIS combines layers of data to find the best alternatives, saving invaluable time for a government or a company.
In many areas of business such as manufacturing and banking, organizations must meet government regulations regarding pollution and interstate trade. GIS provides tools to help companies comply with local, state, and national regulations.
These developments will, in turn, result in a much wider use of the technology throughout science, government, business, and industry, with applications including real estate, public health, crime mapping, national defense, sustainable development, natural resources, landscape architecture, archaeology, regional and community planning, transportation and logistics. GIS is also diverging into location-based services (LBS). LBS allows GPS enabled mobile devices to display their location in relation to fixed assets (nearest restaurant, gas station, fire hydrant), mobile assets (friends, children, police car) or to relay their position back to a central server for display or other processing.
A key difference between viewing map information on paper or mylar versus using a GIS is that each person using the GIS can create their own view of information. Each individual user can choose what to see, why to see it, how to see it, and how to use it. The content of any paper or mylar map can probably be converted (“digitized”) for use in the GIS.

GIS in Detail:
GIS use Space-Time as a key index variable for all other information in like RDBMS where text or numbers can relate many different tables using key index variables. This key is the location and/or extent in space-time. Generally variables used in GIS may be referred as date/time of occurrence and x, y and z coordinates representing longitude, latitude and elevation resp.
In modern GIS, method data creation is digitization, where a hard copy maps, survey, layouts or some other existing maps are transferred into a digital medium through the use of a computer- aided design (CAD) program, and geo-referencing capabilities.
GIS is system which consists of Data Representation, Data Capture, Projections, Coordinate Systems and registration, Data modelling, Networks, Map Overlays, Data Output.       

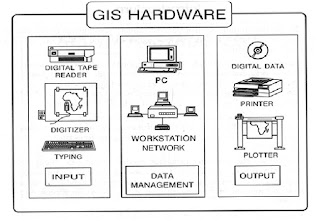
Components of GIS:

Software Of GIS:
          
This consists of -
1.      Graphical user interface for downloading and viewing GIS information including such simple interactions as magnification and measuring distances.
2.      A viewer for formulating queries and simple editing  including selection based on attributes or location, changing color and resolution; merging, labeling, and creating reports.
3.      An editor for data manipulation and editing  including layering.

Six Major GIS Software  Providers:
1.      Aotodesk – Offers Autodesk.
2.      ESRI – Offers Arclnfo/Arc view.
3.      Geographic Research Inc.- Offers simply Maps.
4.      Intergraphs- Offers Geomedia.
5.      Manifold System – Offers Manifold Enterprise Addition.
6.      Mapinfo – Offers Mapinfo.

GIS technology, as an expansion of cartographic science, has enhanced the efficiency and analytic power of traditional mapping. GIS technology is becoming an essential tool to understand the impacts of this change over time. GIS enables the combination of various sources of data with existing maps and up-to-date information from earth observation satellites along with the outputs of climate change models. This can help in understanding the effects of climate change on complex natural systems. One of the classic examples of this is the study of Arctic Ice Melting.
The outputs from a GIS in the form of maps combined with satellite imagery allow researchers to view their subjects in ways that literally never have been seen before. The images are also invaluable for conveying the effects of climate change to non-scientists.
.


(  
This article is the topic of unit "IT Trends" from Nagpur University syllabus MBA 3 rd Sem IT  notes.

Topics of this unit are is covered in other blog post. Links are given below.
  1. Biometrics
  2. Neural Network
  3. Google Earth
  4. Audio Visuals MPEG
  5. I-Pod
For more notes you can also refer to other links as given below 
 
)